Carte Marine : Voir
Summary

Wind
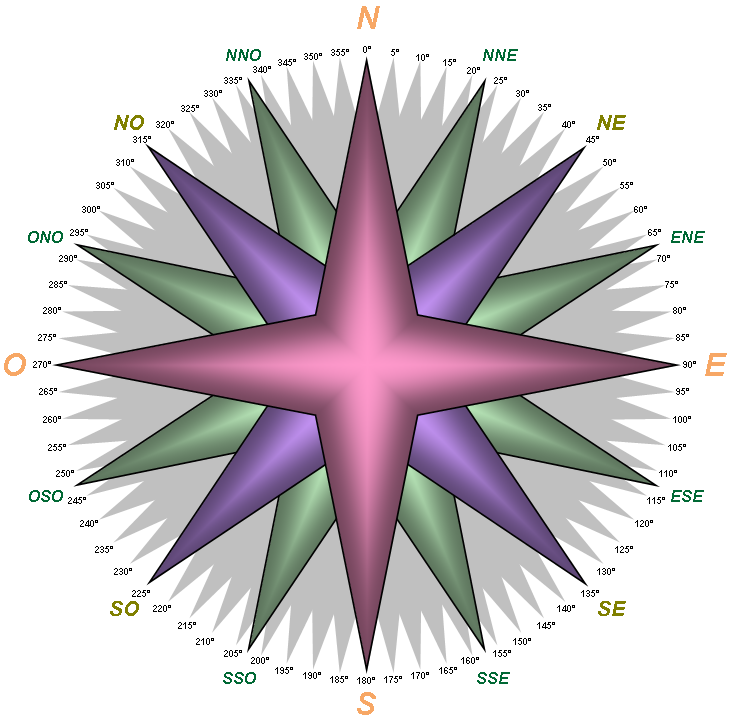
Direction 
Main screen capture, last 12 hour graph
The data are graphed at two minute intervals, but there is data recorded every minute. On the graph, the Red line represents the maximum gust of wind for that interval.
Rain:
Comparaison depuis 2010 : Voir (Par Années)

Last 24 Hours
Last 48 Hours
Last 72 Hours
Daily high low
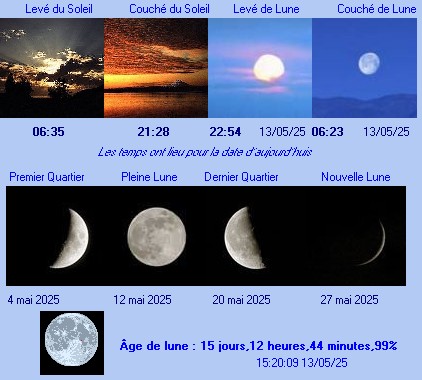
Moon , Sun, Seasons